Power BI
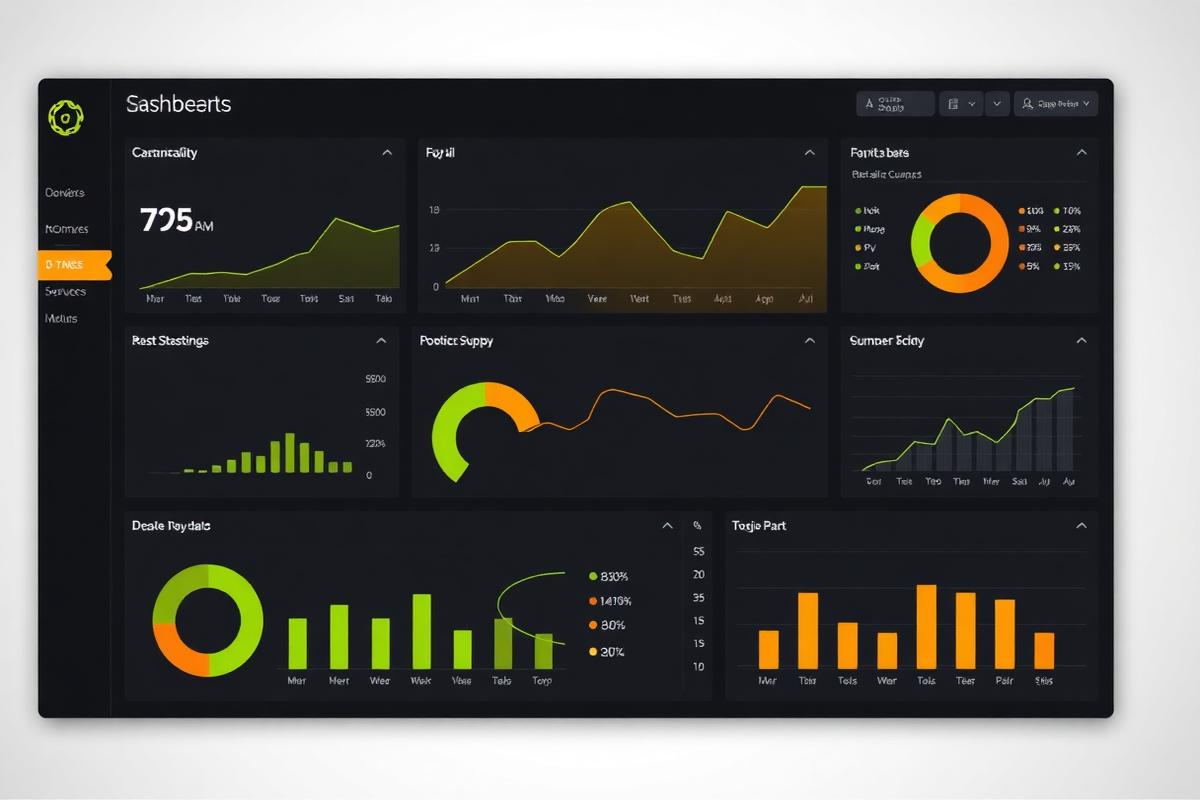
Retail revenue command center
+38% YoY visibility
Practical writing on Power BI, SQL, dashboard design and the soft skills that make analytics actually land.
A short summary of recent engagements — the brief, the build, and the measurable outcome each client walked away with.
+38% YoY visibility
-22% churn in 90 days
1 source of truth, 7 teams
The five questions to answer before you drag the first visual onto a Power BI canvas — and how to avoid the 'beautiful but unused' trap.
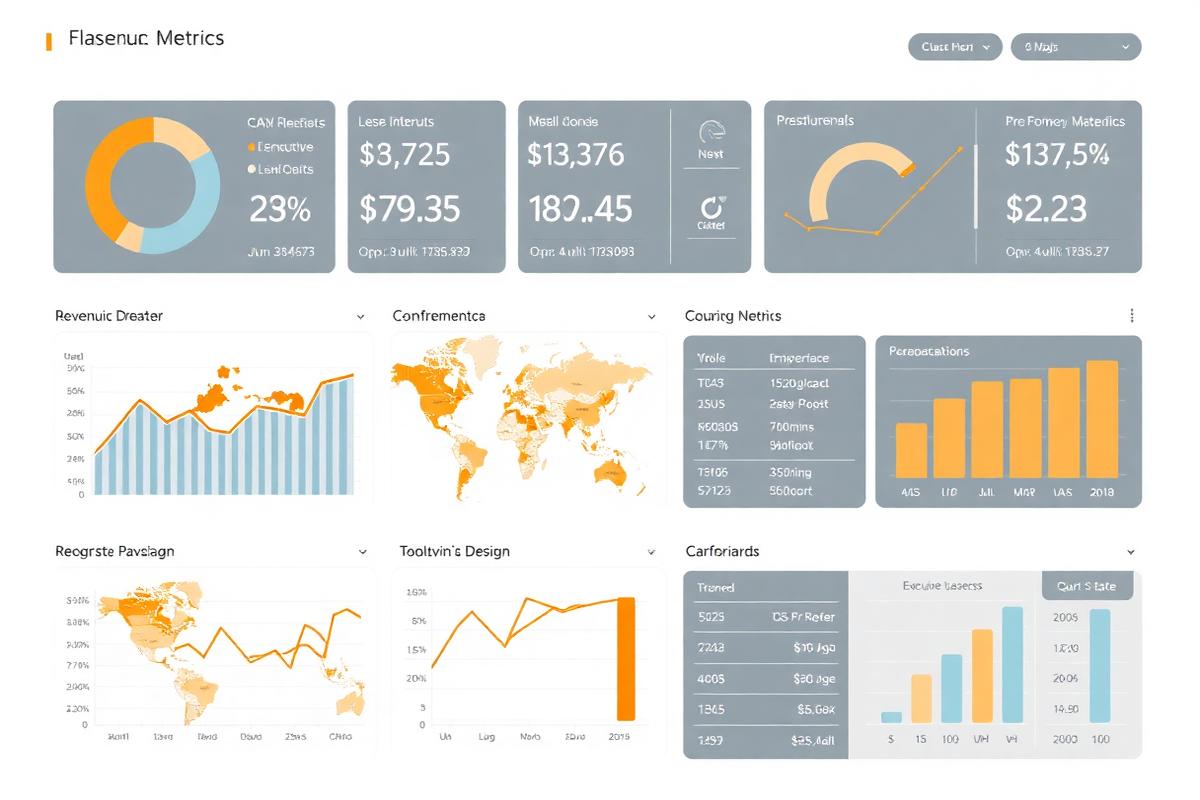
Dashboards that people actually open.
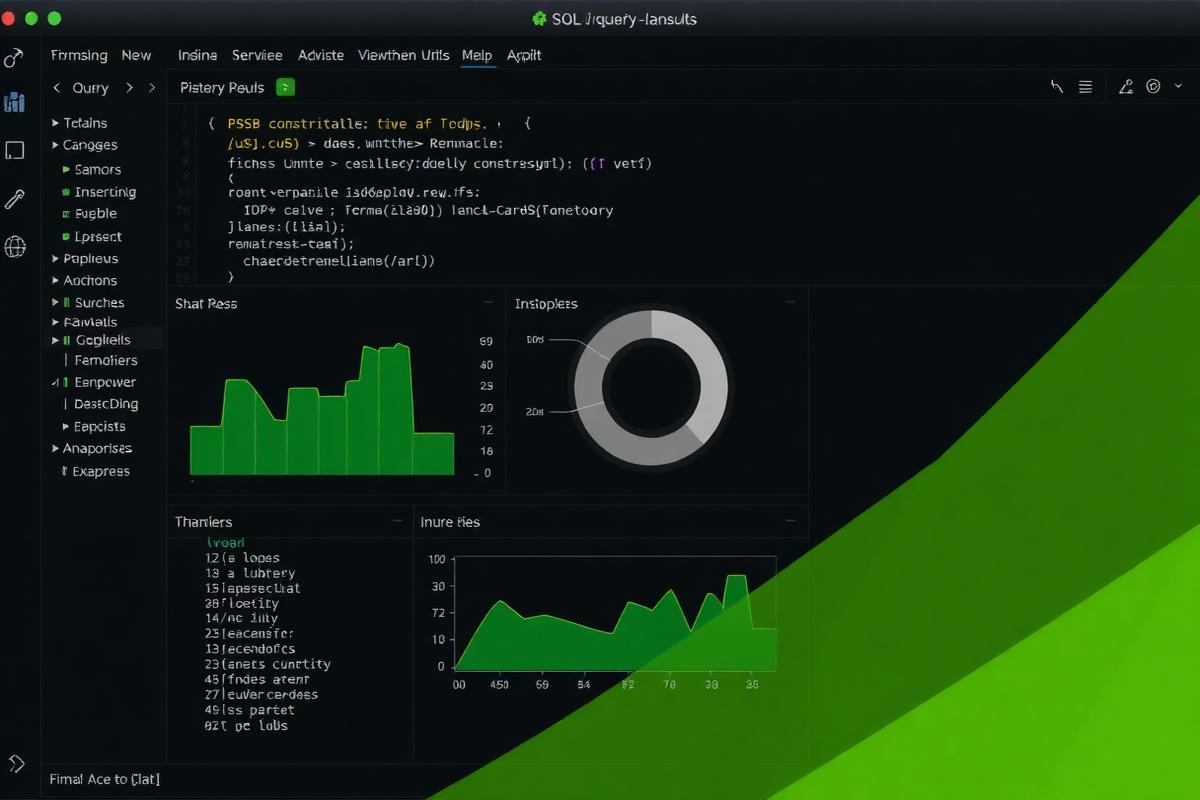
From running totals to cohort retention — the SQL patterns I reach for in 80% of analytics work.
Tool selection is less about features and more about your team's habits, budget and refresh needs.
A small, opinionated pipeline that pulls, cleans and publishes a weekly KPI report — fully automated.
Naming things correctly is half of analytics maturity. Here's the model I use with every client.
Time intelligence, dynamic measures, and the SAMPER trick that's saved me a hundred hours.